The triangle
of the temperature in Mt. Tsukuba
In University
of Tsukuba, temperature, atmospheric pressure, a wind direction, wind velocity,
etc. are observed every 10 minutes.
It is
characteristic to also observe a surface temperature and a temperature 1cm below
ground.
Since data
was also five years, it carried out the statistical work.
As a result,
the surface temperature was consistent with wet-bulb temperature.
1. Observation Position and Data.
Paige with
data
http://mtsukuba.suiri.tsukuba.ac.jp/sub6.html
observation position
140.098
degrees east, 36.225 degrees north, altitude 868 m
2. Air, Surface, and Underground
Probably, you
know that it is thermal insulation about soil and air.
I think as
follows.
The surface
is heated by sunlight.
The surface
heats air and underground.
Air is warmed
by a convection.
Underground
is heated by heat conduction.
3. Frequency distribution of temperature of air, the
surface, and underground.
3-1. The Frequency
distribution of the air temperature
The following
graph is the frequency distribution of the air temperature at 1.5m extracted
above ground.
.

Data were in
1996 to 2000 and the number of data was 262780.
The maximum
temperature of data is 30.4 ℃.
The lowest
temperature of data is -10.6 ℃.
The next
figure is the frequency distribution in January, March, and November.

A vertical
axis is the number of times of observation, and a horizontal axis is
temperature.
The triangle
was made with the sharp peak in January.
A peak is
somewhat lower than 0 ℃.
The following
graph is in April, June, and August.
Each made the
triangle.
Especially,
it had the strongest peak in August.

Japan is
needed under rule of a Pacific huge high pressure in August.
Average
temperature will fall bordering on August.
Why is the
sharp peak in January and August made? A reason is not known although it is an
interesting fact.
The
difference between January and August may be because of the wind.
January the
wind is blowing and easy.
3-2. Frequency
distribution of surface temperature.
The next is
the frequency distribution of surface temperature.

The number of data is 262780.
The highest
temperature of data is 42.6 ℃.
The minimum
temperature of data is -15.1 ℃.
The next is
the frequency distribution in January, March, and November.

.
The
temperature of a peak is lower than air about 2 ℃.
The triangle
was made also even in March and November.
Next, it is
in April, June, and August.

It has a
sharp peak in August.
What is the
cause of a peak?
3-3.Frequency distribution of Underground temperature

.
The number of data is 262780
The maximum of frequency is 8058 at 0.1℃
The highest temperature of data is 36.8℃.
The minimum temperature of data is -6.1℃.
An unusual peak is in about 0℃.
I can think that 5 to 25 ℃ has
appeared in equal probability.
The number of times of an appearance of -0.5 to 0.5 was
36640.
It was 14% of the whole.
.
Now, the surface is heated with sunlight.
The warmed surface heats underground.
Even if 0 ℃ of
underground ice is warmed, it becomes a 0 ℃ liquid
more often.
Moreover, even if a 0 ℃ liquid
is cooled, it becomes a 0 ℃ solid more often.
I think the underground temperature is affected by water.
Next, it is in January, March, and November.

A peak is in
about 0 ℃ in January and March.
However, the
peak in November is not clear.
I think that
ice has not been made yet in November.
I think that
ice has not melted yet in March.
January of
the frequency of -0.5℃ to 0.5℃ is 14600
(67%).
The frequency
in February is 13780 (68%).
It was about
1500 times that 0 ℃ or less became in December.
The following
graph is in April, June, and August.

4. Surface
temperature and air temperature In August.

In area A,
the temperature of the surface and air is the same.
In area B, the
surface temperature is high.
In area C , the
surface temperature is low.
Let's check a
daily variation.

The surface
temperature falls from 12:00 noon.
The
underground temperature falls, after becoming the same as the surface.
It falls,
after the temperature of air also becomes the same as the surface.
The surface
and underground are exchanging energies by heat conduction.
I think that
the surface is heating and cooling underground.
The temperature
of air is warmed by a convection.
The surface
cannot cool air except for nearby air.
I think that
something is cooling air and the surface.
Please see
the following graph.

The surface
temperature is in agreement with the wet-bulb temperature of air.
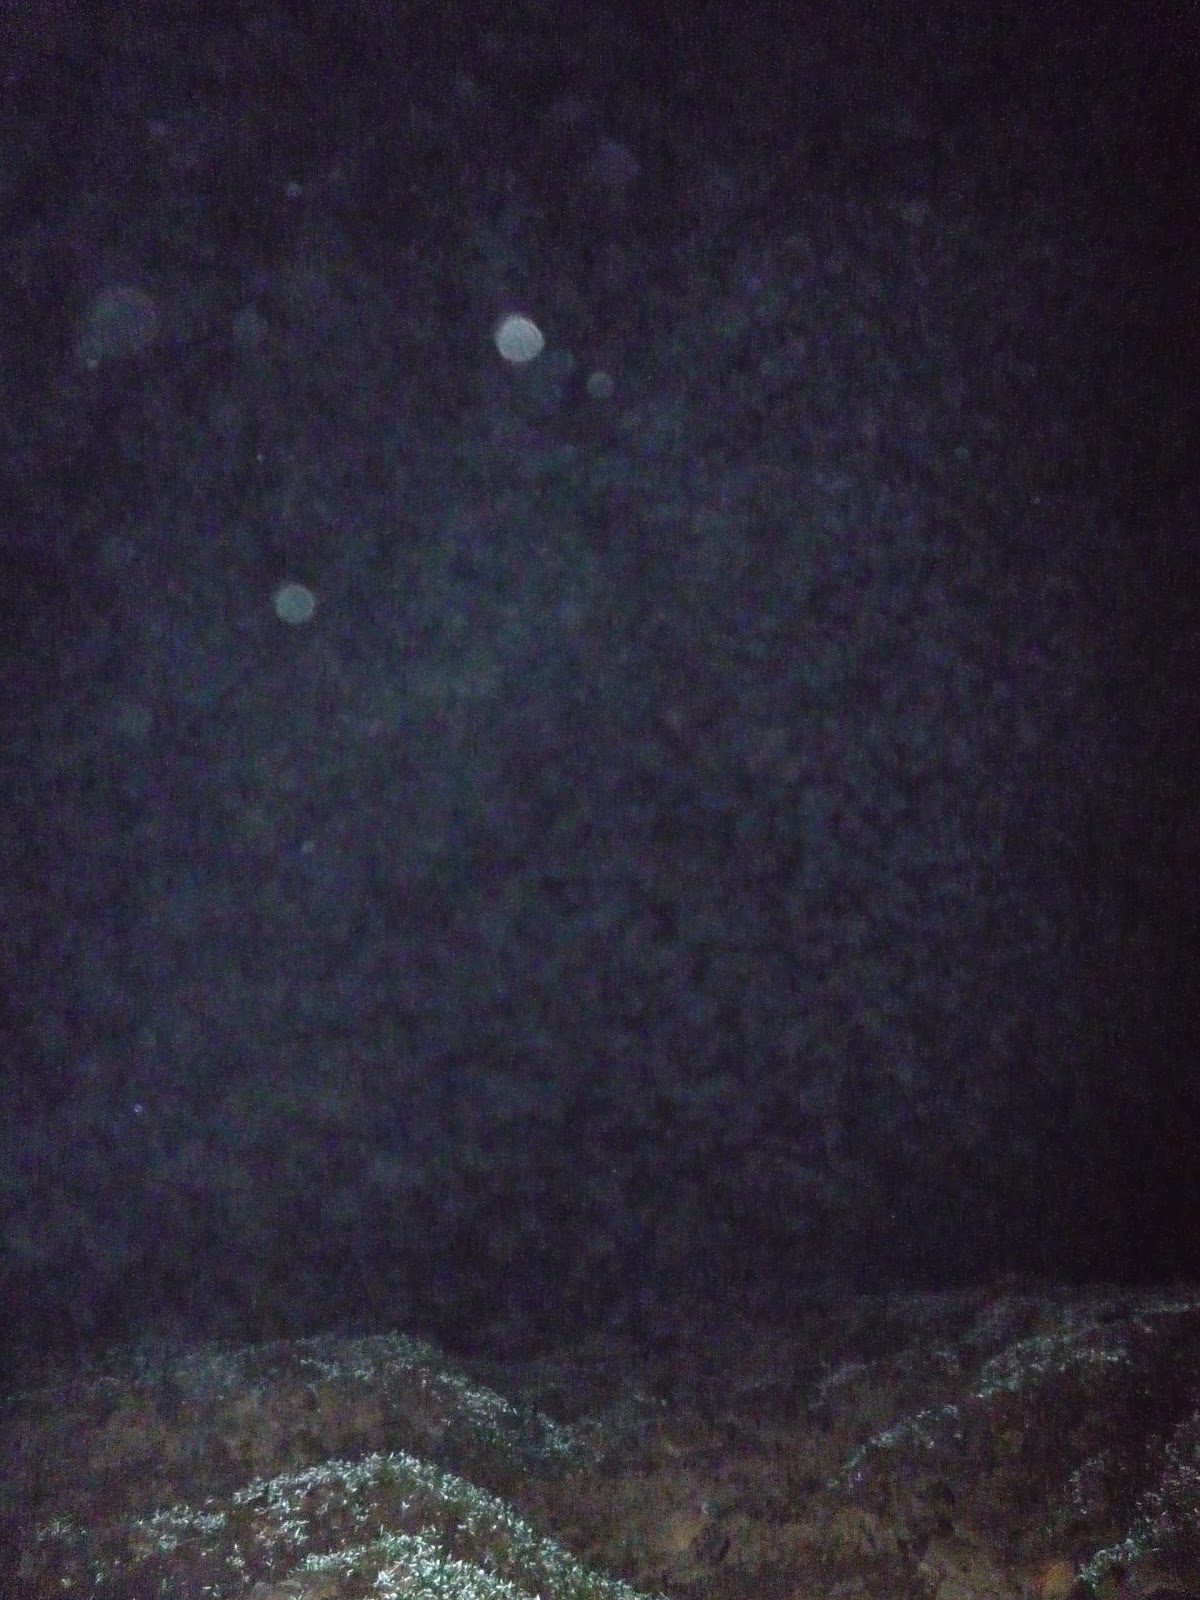
5. Aube at Mt. Kumotori
It is Aube
which carried out flash photography at Mt.Kumotori.
Aube is
attached on stones.
Aube attached
on stones is not visible.
The next
photograph lengthen exposure time and photographed it.

I It was a bright night by the moon.
I think that
Aube is rainfall
phenomena.

The roof has
got wet.
If it often
sees, Aube is also falling down.
If Aube is
water, the temperature will turn into wet-bulb temperature.
And the
temperature of a roof also turns into wet-bulb temperature.
If it is fine
weather and dry, the temperature of the roof is lowered.
The Radiative Cooling phenomenon is an error.
****
Please look
for the next page, if you need wet-bulb temperature by Excel.
0 件のコメント:
コメントを投稿